Appearance
Analytics
Performance Now! puts real-time, actionable analytics at your fingertips—no complex setup or technical skills required. 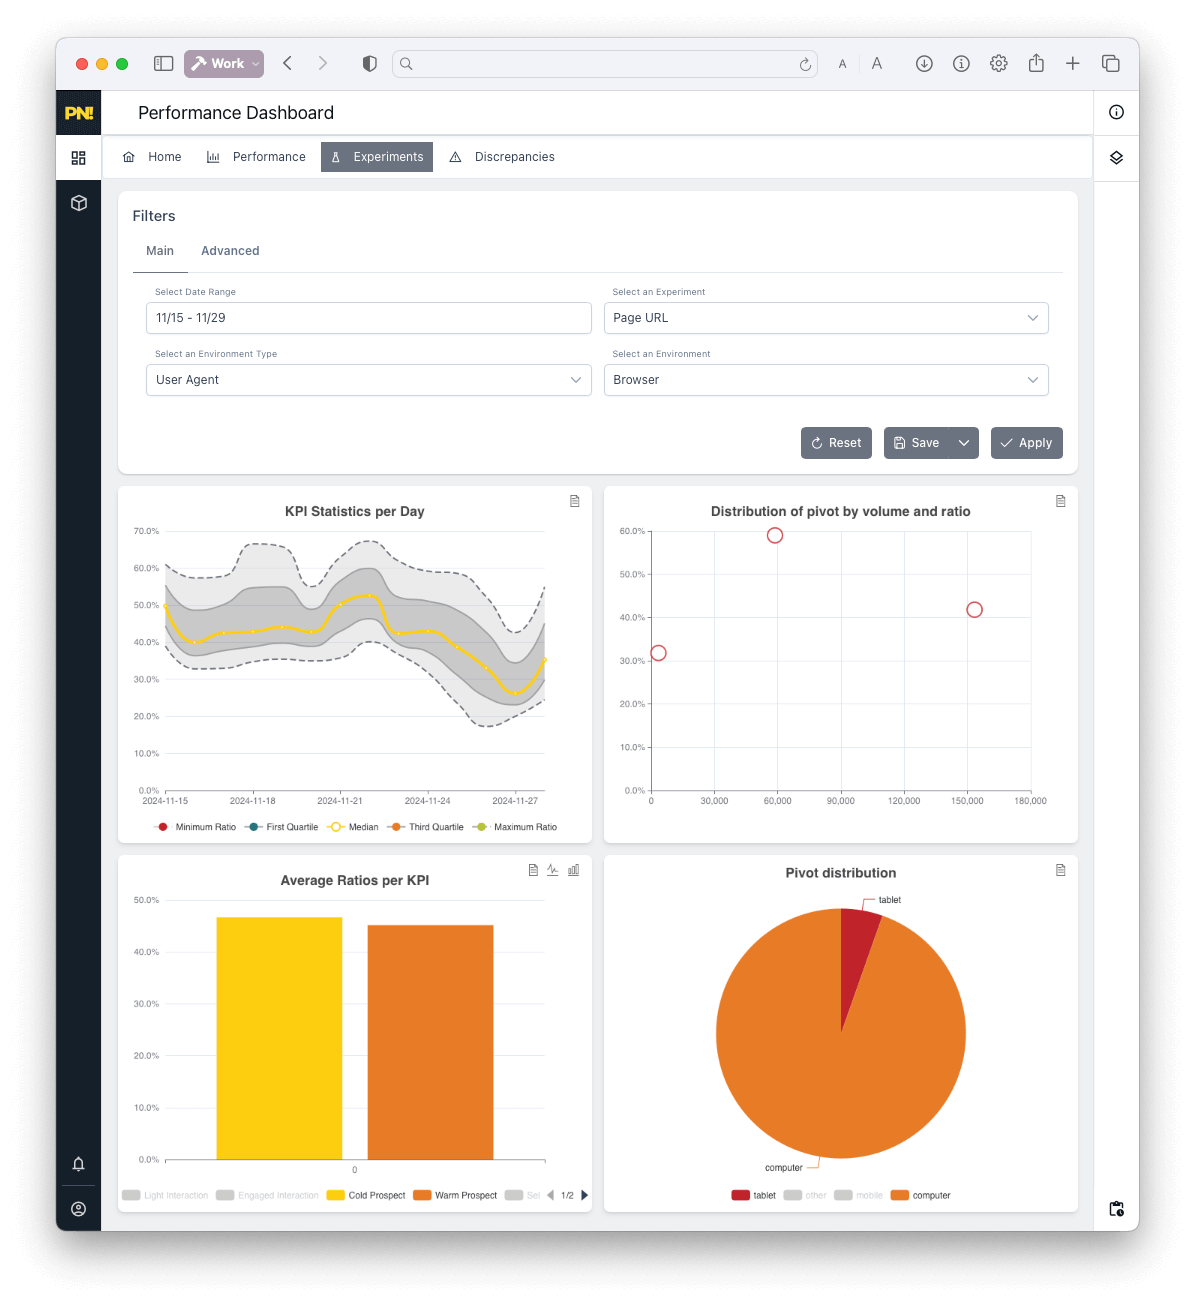
What You Can Track
- Sessions: Every visit to your site, regardless of source.
- Users: Unique visitors tracked via anonymous methods—no cookies, no PII.
- Pageviews: See how users move through your site.
- Events: Button clicks, form submissions, conversions, or any custom activity.
- Funnels: Visualize the path from first visit to conversion, step by step.
How to Use Analytics
- Tag installed?
Data will start flowing into your dashboard immediately. - Navigate to the Analytics section
Find “Home” or “Reports” in your dashboard to explore real-time stats. - Explore dashboards
Use summary charts, tables, and activity feeds for a high-level overview.
Practical Tips for New Users
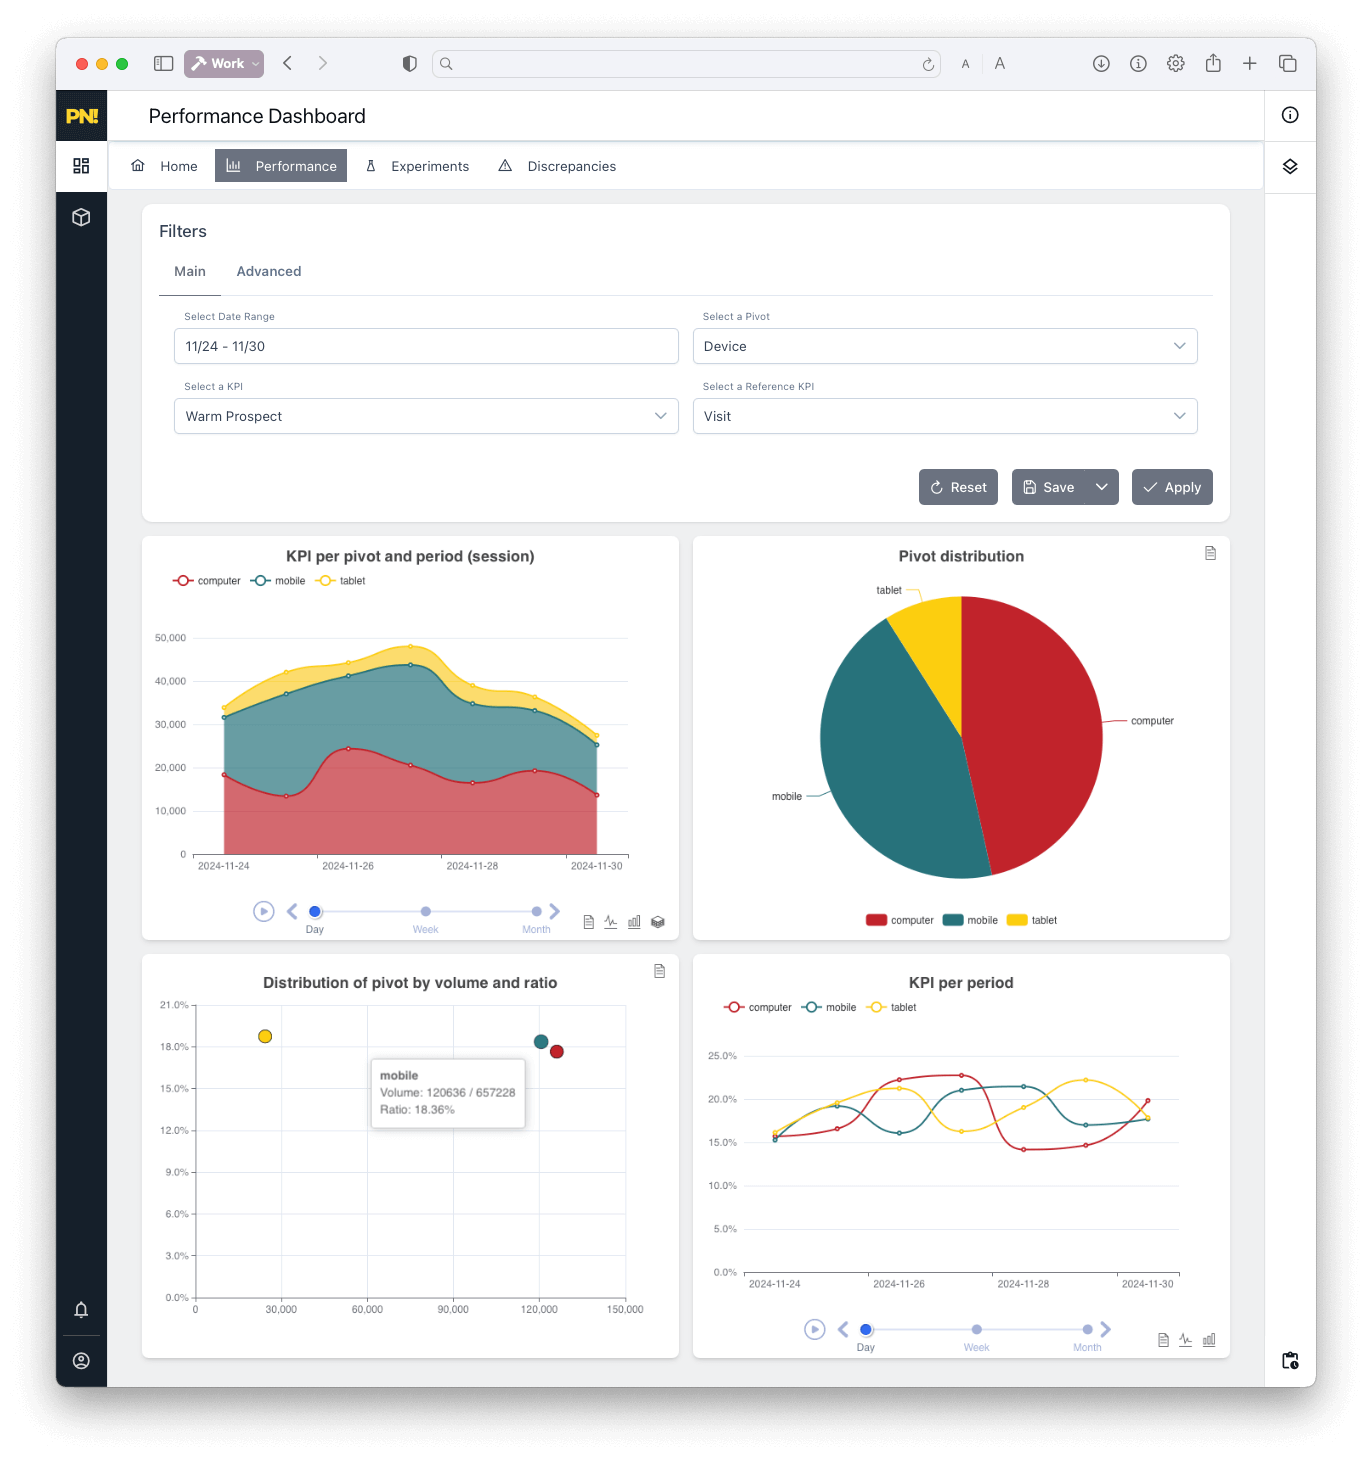
See how each ad campaign, channel, or device performs:
In the Reports tab, select the main dimension such as “Source,” “Medium,” or “Device.”
This will show you which traffic sources or devices are bringing in the most users or conversions.
Learn more about using ReportsCompare traffic and conversions over time:
Use the date picker at the top of the dashboard to switch between last 7 days, 30 days, or a custom range.
You can instantly compare trends for any metric.
Tip: For recurring business reviews, save your favorite time period as a preset for one-click future access.
See how to use and save presetsIdentify drop-off points in your funnel:
Switch to the Funnels/KPI view (if available in your dashboard).
Here, you’ll see each step (visit, add to cart, checkout, payment, etc.) as a visual funnel.
Look for steps with high drop-off, then click to filter and dig into what’s causing user loss.
Setting up and using Funnels/KPIsExport analytics data for custom analysis:
Use the “Export” button at the top of most tables or reports.
Download CSV files for your own pivot tables or detailed analysis outside the platform.
Exporting and working with dataTroubleshoot missing or unexpected data:
If you notice a gap in tracking, revisit your tag placement (see Tag Setup).
If you still see issues, the [FAQ]../support/faq.md) has targeted solutions for common problems.
Still have questions? The Support page connects you directly with help.