Appearance
Performance Tab
The Performance tab lets you go beyond standard reports and visually explore every angle of your site’s performance by enabling interactive charts and deep-dive analytics.
Just click on any element to filter the entire dashboard instantly.
Interactive Charts
You’ll find four dynamic charts designed for live exploration:
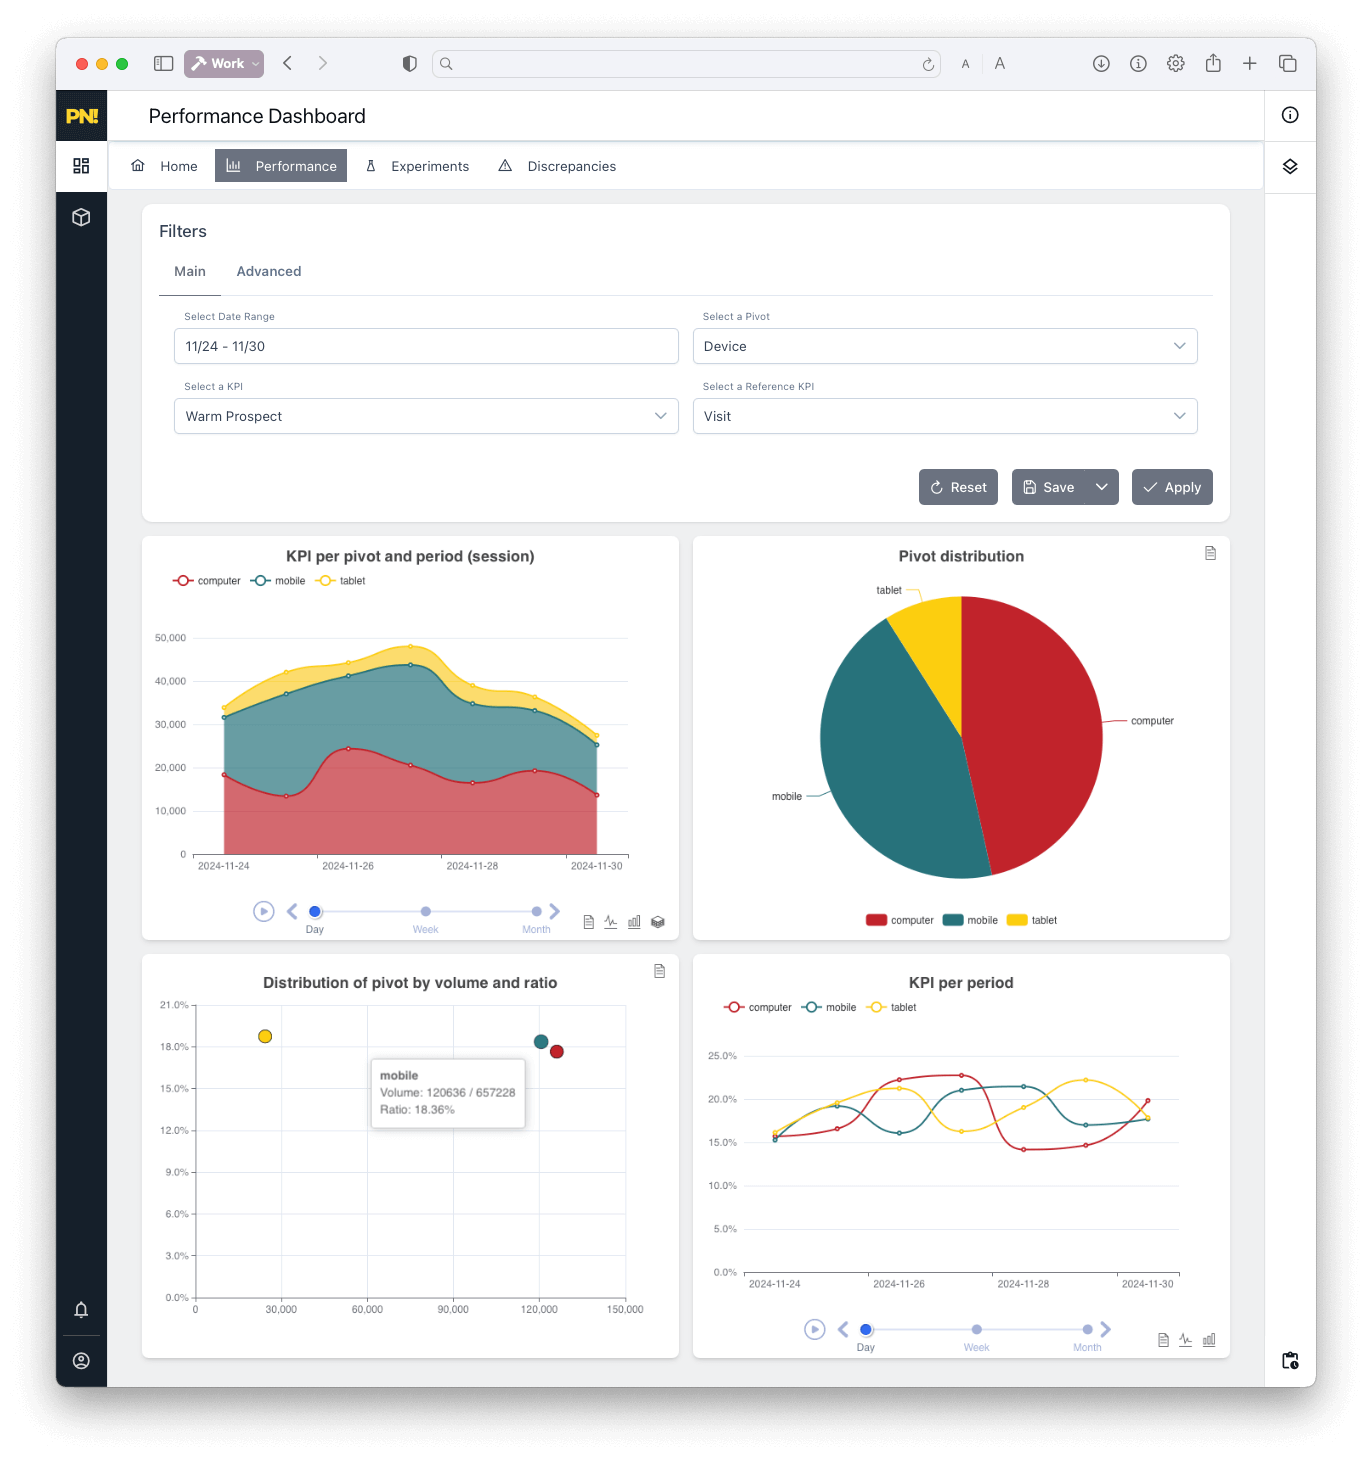
KPI per Pivot and Period:
Visualize your key metric (like conversions) over time.
Change the period (day, week, month) for different views.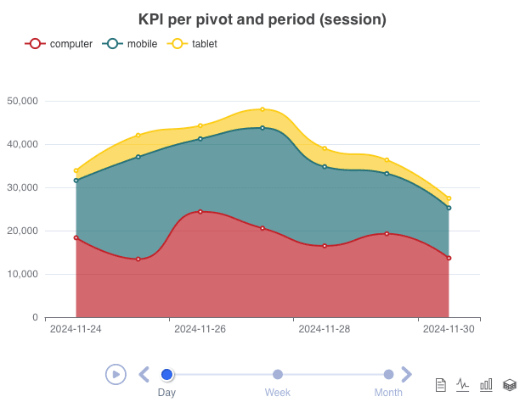
Pivot Distribution:
See how your main dimension (like device, channel, or campaign) breaks down by KPI.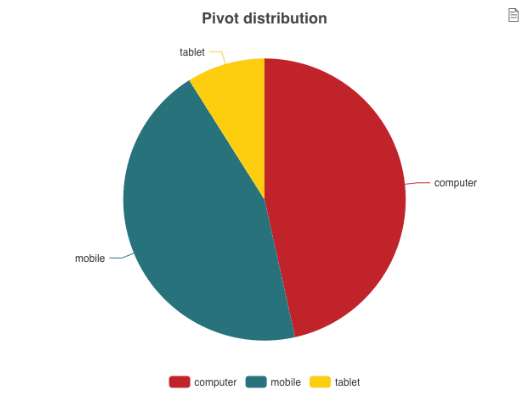
Distribution by Volume and Ratio:
Answer the question: “Which segment delivers at scale?”
Analyze performance both by total volume and by conversion ratio.
KPI per Period (Conversion Rate):
Visualize your conversion rate across your chosen period—spot trends instantly.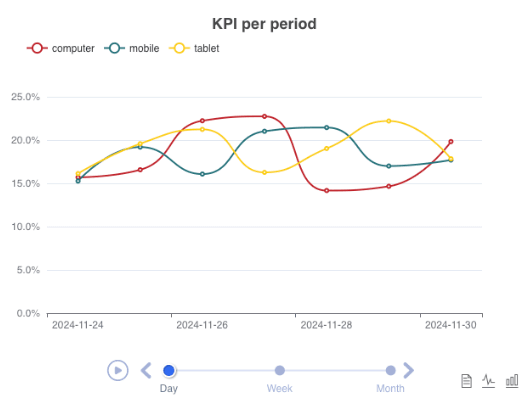
Click any element in a chart to instantly filter the rest of your dashboard by that value.
Remove filters from the Advanced panel at any time.
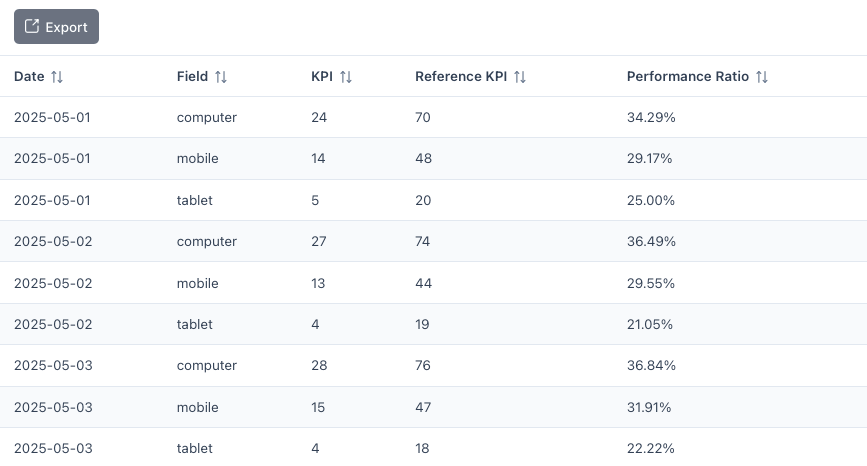
Data Table & Export
Below the charts, view the raw data table behind your selections.
Use the Export button to download all chart/table data as CSV for deeper analysis.
Main & Advanced Modes
- Main: Fetches latest server data; ideal for accuracy.
- Advanced: Lets you filter and pivot instantly for live “what if” analysis using cached data.
Using Presets
Any configuration you create (pivot, period, filters) can be saved as a preset for future one-click access.
See the Presets Guide
Best Practices
- Use interactive filtering to “zoom in” on high-value segments.
- Save presets for regular analysis or reporting routines.
- Export any view for further work in Excel, Google Sheets, or BI tools.
Next Steps: Turn Insights into Action
Don’t just explore—act on your findings:
- Set bid modifiers in your ad platform based on high-performing or underperforming dimensions (e.g., time of day, device, ad group).
Example: If “Mac OS” users convert best in the 19-22pm window for “Ad Copy #1”, set higher bids for this combination in your ad tool. - Cut low-performing segments: Filter for segments with consistently poor conversion rates and consider excluding or reducing bids for these groups.
- Save and share presets for recurring business questions or to coordinate with your team.
If you need help interpreting data or building an action plan, contact support.