Appearance
Experiments Tab
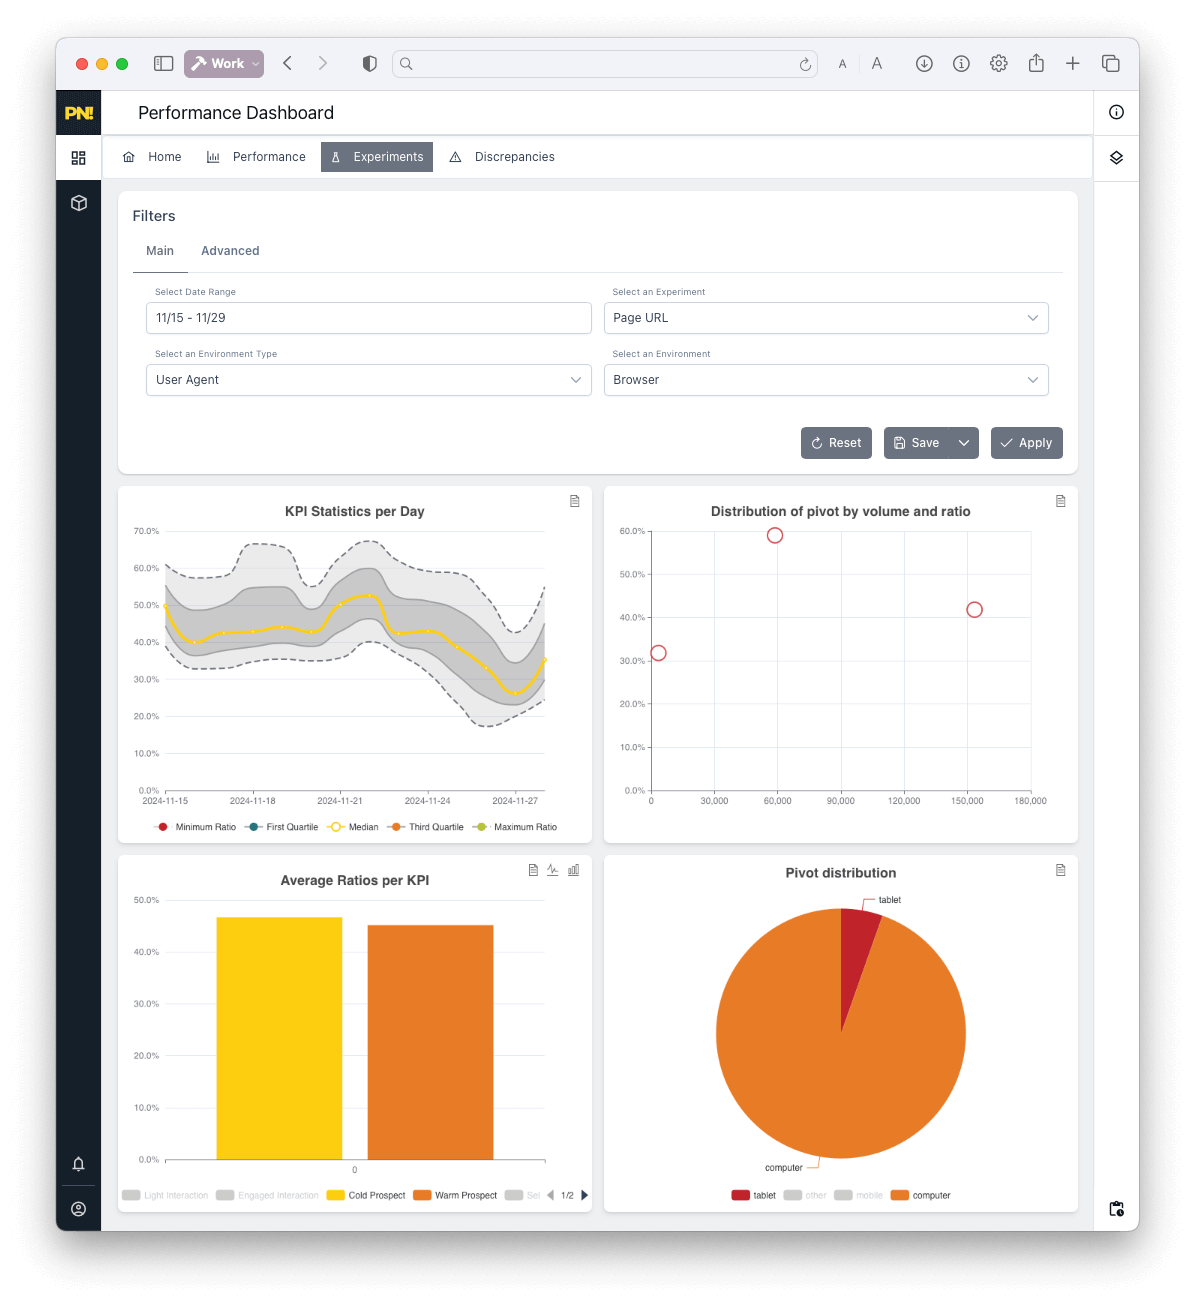
The Experiments tab gives you a focused view of all your active and historical A/B tests.
Discover which variants perform best, visualize results, and find new opportunities for growth.
Key Features
- Track every experiment and outcome—URL-based, content, CSS, or bulk tests
- Four interactive charts for deep exploration
- Dynamic filtering—click any outcome to drill down instantly
Main Charts
KPI Statistics per Day:
See how each outcome performs over time.
Useful for spotting trends and stability before declaring a winner.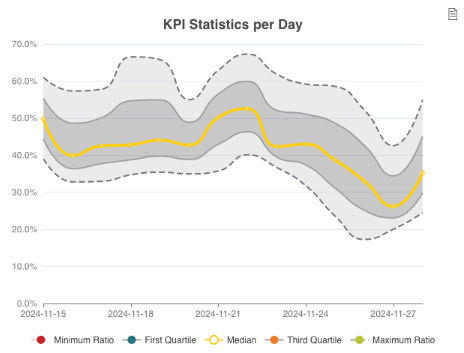
Pivot Distribution:
Compare all major outcomes (e.g., product, copy, variant) in a single view.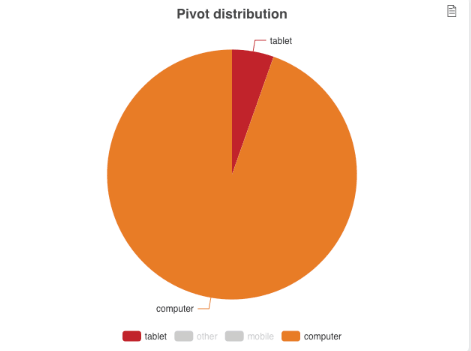
Distribution by Volume and Ratio:
Analyze not just which outcome “wins” overall, but which ones deliver consistently at scale.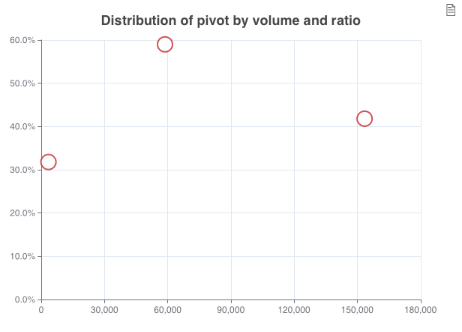
Average Ratio per KPI:
Focus on conversion rates and effectiveness for each test variation.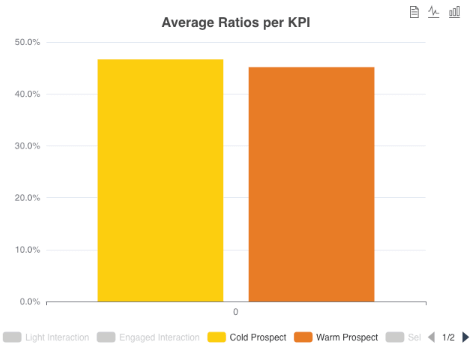
Tip: Click any segment in a chart to filter all other charts to just that outcome. Click again to remove the filter and return to a full view.
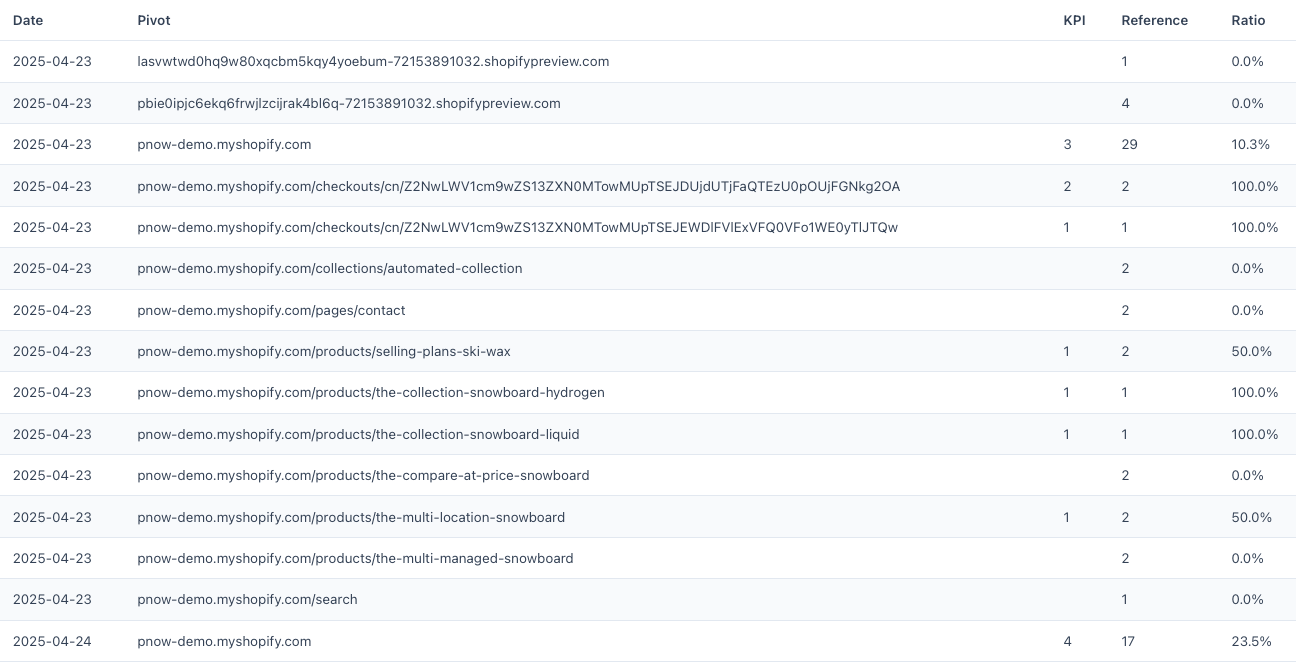
Data Table & Export
At the bottom, find the data table with detailed results for each experiment and outcome.
To download chart-level data, click the document icon on any chart (CSV export).
Using Presets
- Save your favorite analysis views as presets for quick access later.
- See Presets Guide
Next Steps: Optimize Your Outcomes
Looking at your experiments is just the start—here’s what to do next:
- Deactivate losing outcomes:
If a variant is underperforming, deactivate it directly from the dashboard or in bulk. - Deactivate or archive whole experiments or optimizers that are no longer needed.
- Batch edit for speed:
Use the upload/download feature for fast, large-scale changes across many outcomes or experiments. - Continuously launch new tests:
Use learnings from your best-performing variants to design smarter follow-up experiments.
For help with batch editing, advanced setup, or experiment strategy, contact support.