Appearance
Reports Tab
The Reports tab is where you turn raw data into answers—flexible, powerful, and designed for both quick checks and deep dives.
Start with Presets
Fastest path for everyone:
Before you build a custom report, select a team or system preset from the Preset menu.
These answer the most common business questions with a single click—ideal for new users or recurring business reviews.
See more about Presets and how to create your own.
Main vs. Advanced Modes
- Main:
Pulls fresh data from the server. Use when you want up-to-date numbers or are applying new filters. - Advanced:
Lets you instantly switch views/filters using cached data. Perfect for rapid exploration or large datasets.
Filters, Dimensions, and Metrics
- Main Dimension: The primary split—by source, device, campaign, etc.
- Secondary Dimension: Add a sub-breakdown for deeper insight.
- Metric: Choose what to measure—sessions, conversions, drop-off, etc.
Use “Environment Values” to analyze custom product, region, or parameter data.
How to Use Reports
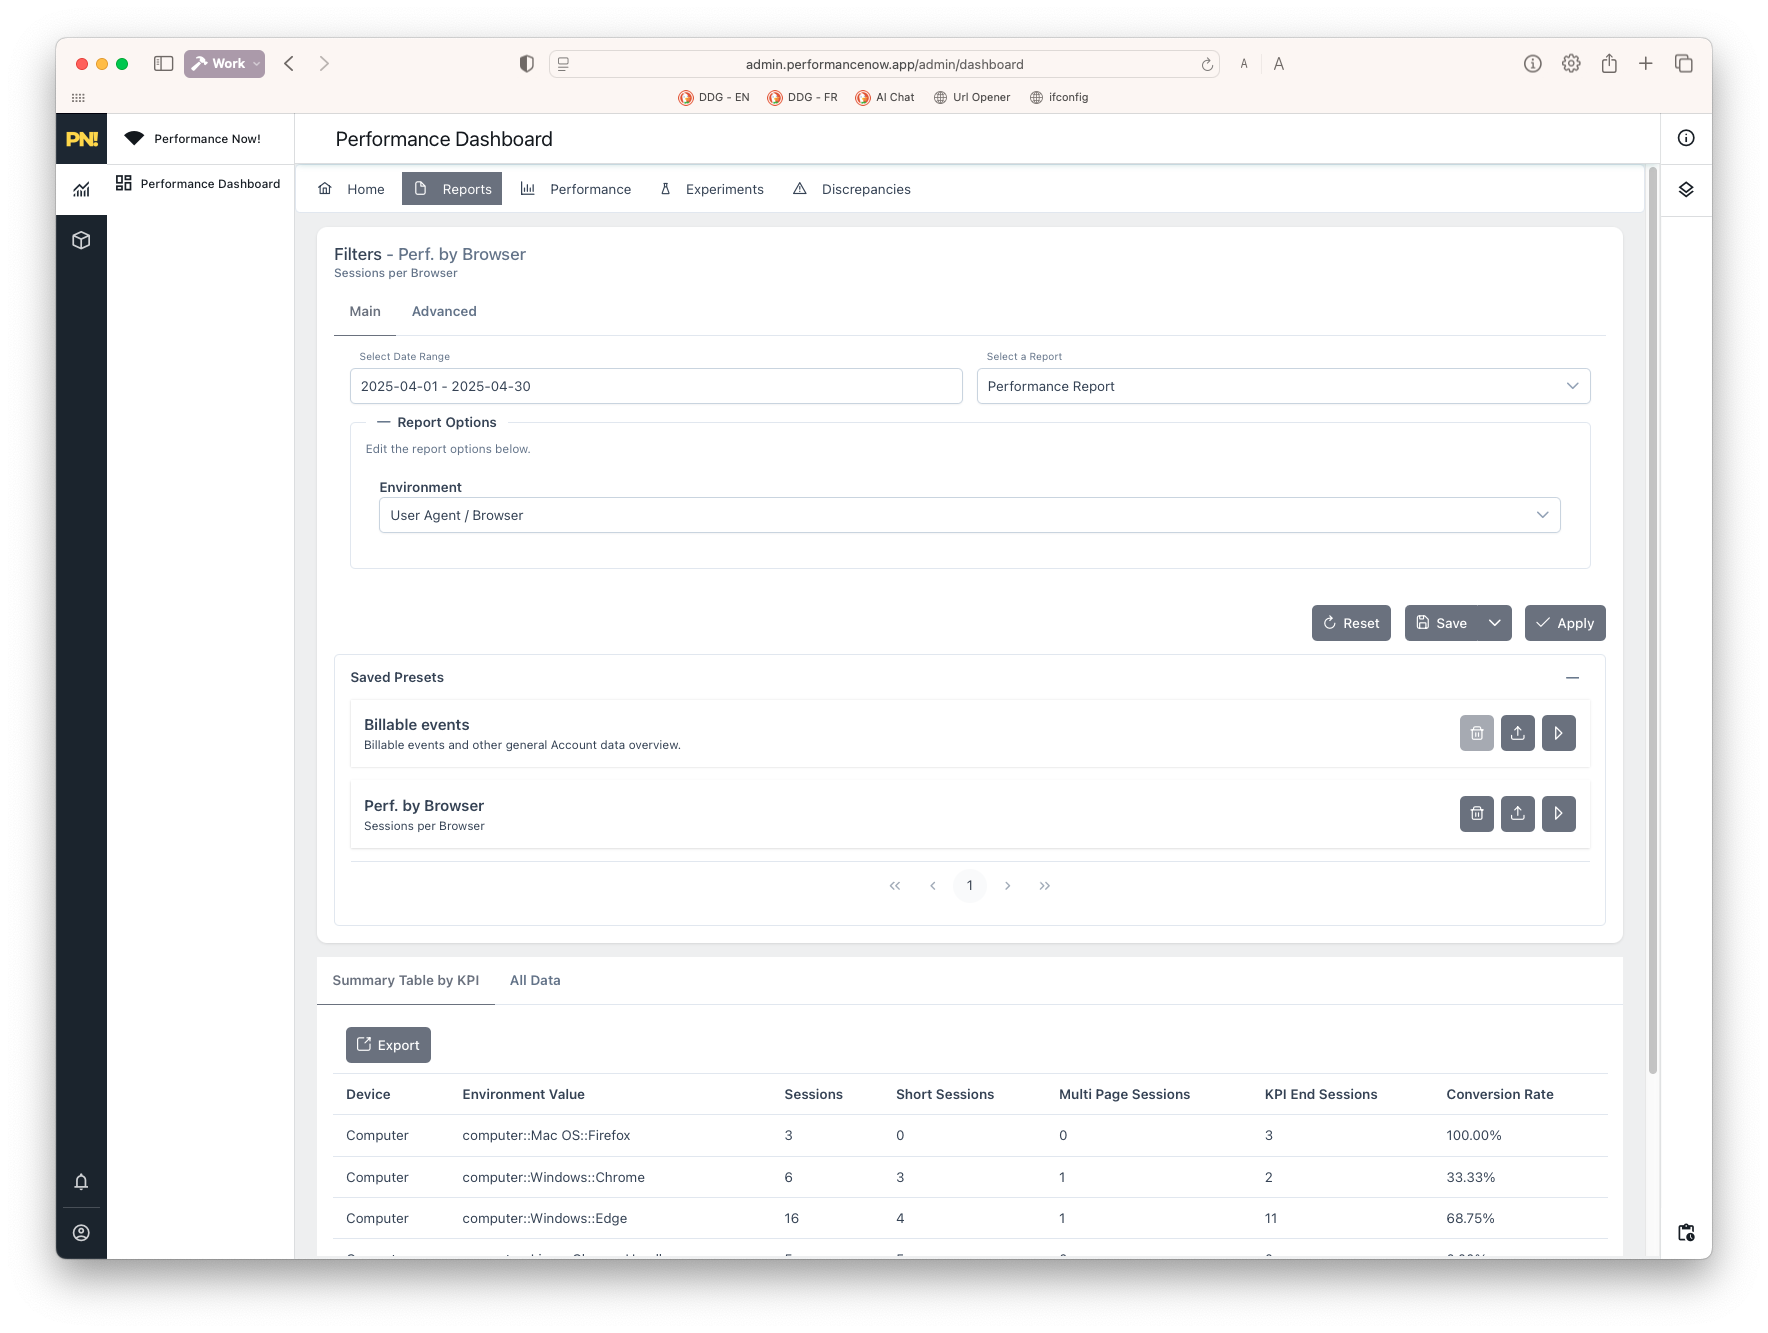
The Main tab is your starting point for quick insights. Here’s how to use it:
Select a Report Preset
Choose from the dropdown to load a raw report.We recommend starting with a preset to see common metrics and dimensions already set up. If you want to build your own from scratch, switch to the Advanced tab.
Set the Date Range Use the date picker to focus on a specific period—today, last week, or custom range.
Explore Environment Values This is where you can see the actual data you want to explore, such as:
- First Page:
First page of sessions, with options to group by page category (e.g.,/products/summer/t-shirt=>/products/summerand/products). - Browser Language:
Language settings of users. - Date:
Grouped by type of day, hour, etc. - Geo:
Geographic location of users (note that VPN users are marked asvpn_users). - Request:
UTM parameters and any custom parameters you track (configure these in Site admin panel). - Bot Filtering:
Bot score of visitors. - User Agent:
Technical info about the browser; useful for seeing social media shares.
- First Page:
Tracking Social Media Shares
Note: The "Messaging App" and "Messaging App Name" fields let you see social media shares even if users don't click on them. The simple act of sending a share triggers tracking, which is a note-worthy feature.
Couple this with a custom domain for your share links to track shares more effectively and transparently.
Advanced Tab
Display Options
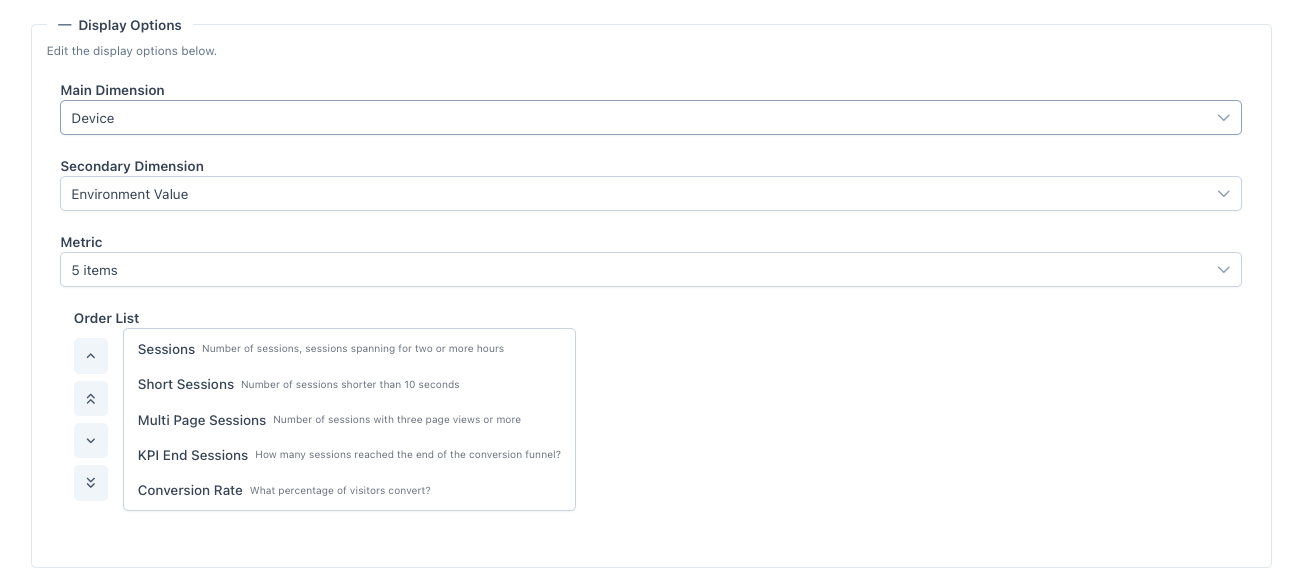
- Main Dimension:
The primary column of your report, to choose from a wide range of options like Source, Device, or Campaign. - Secondary Dimension:
An additional breakdown for deeper insights using the same options as the main dimension. - Metric:
The data you want to measure (e.g., Sessions, Conversion Rate). Metrics are displayed as columns in the report. - Order List:
Click on a selected metric and use the arrows to change the order of columns in the table.Do not forget to save your changes after adjusting these settings.
Report Filters

- Include/Exclude Elements:
Use filters to include or exclude specific elements from your report before ratios are calculated. For example, you can exclude Tablet from Device and choose a report showing Optimizer and Day of Week to get conversion rates without tablets.
Conversion Options
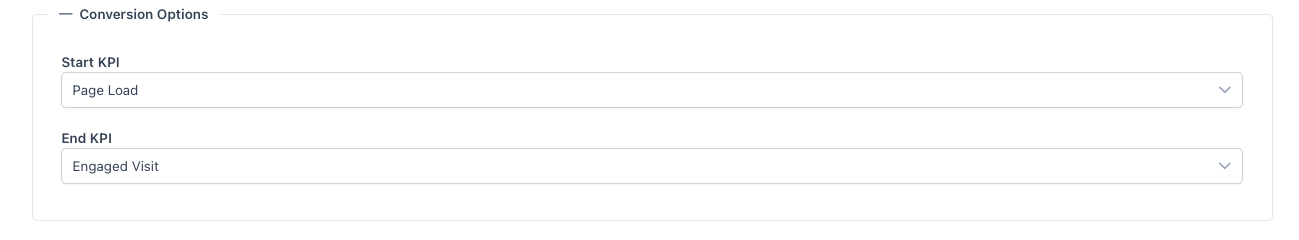
- Start and End Conversion Funnel:
Define where to start and end your conversion funnel. For example, it may not always be relevant to end with a purchase if you want to isolate why engaged visitors dropped off. You can also choose to start from a visit or another event.
Tips for Analysing your Funnels
- Start with Visits:
If you want to understand the entire user journey, starting from visits is often best. - Isolate Drop-offs: If you want to focus on why engaged visitors dropped off, consider starting from a more engaged event like "Add to Cart" or "Sign Up."
- End with a specific conversion event, like "Purchase" or "Lead," This helps you see where users are dropping off in the funnel.
Data Table Overview
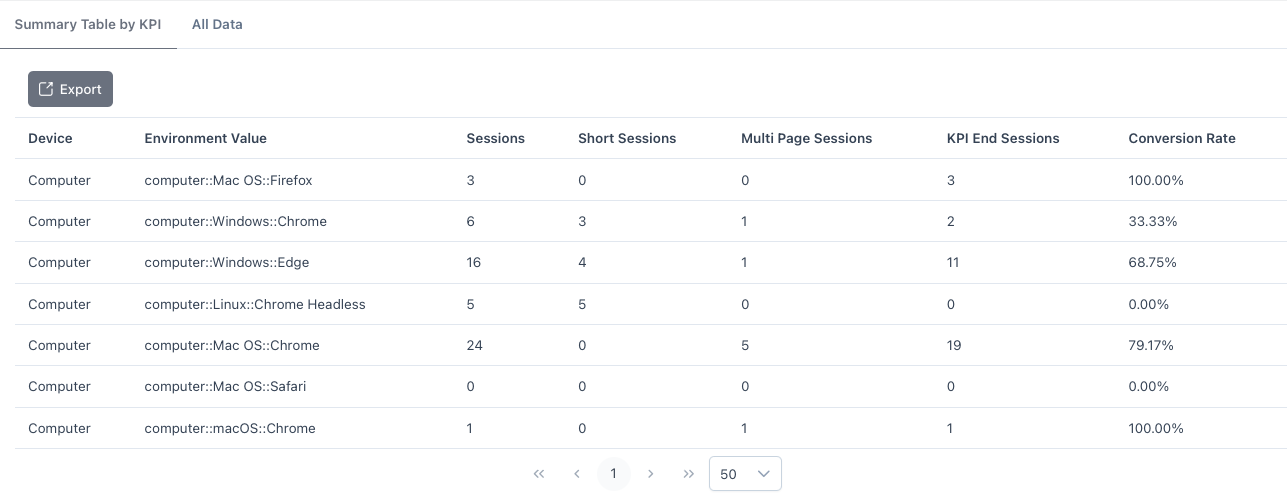
- Tab Summary Table:
Displays aggregated data with all settings applied. This is your main view for quick insights. - Tab All Data: Shows all data without any filters applied, useful for exporting to a spreadsheet program or pivot table.
- Export Button: Click the Export button to download a CSV of the current report for further analysis or sharing.
Building a Custom Report
- Pick your dimensions and metrics
- Apply filters to narrow your focus (e.g., a specific campaign or device)
- Use Advanced mode to quickly test different breakdowns
Exporting Data
- Click the Export button above any table or chart to download a CSV for your own analysis or sharing.
Practical Scenarios
Compare Facebook vs. Google Ads ROI:
Set “Source” as main dimension, filter channels, and compare.Understand funnel drop-offs:
Use “Funnel Step” as main dimension—instantly spot where users leave.Track metrics for a launch:
Filter for your campaign, then save the report as a preset for ongoing review.
For more hands-on examples, see Analytics or the FAQ.
Next Steps: Take Action
Don’t just read reports—act on them:
- Deactivate or adjust campaigns, optimizers, or segments that consistently underperform.
- Use batch editing (download/upload feature) for quick mass changes—ideal for handling lots of outcomes or experiments.
See Bulk & Advanced Experiments for details. - Share presets with your team so everyone is aligned on the key metrics.
If you see technical issues or suspect a site or tracking problem, move to the Discrepancies Tab for a technical health check.