Appearance
Dashboard Overview
The Performance Now! dashboard is your central hub for tracking, analysis, and optimization.
Every tab is designed for a specific purpose—here’s what you’ll find, and how each section helps you move faster and smarter.
Dashboard Tabs

- Home:
Your starting point—get set up, see activity stats, and manage billing. - Reports:
Build and explore reports with flexible filters, dimensions, and presets. - Performance:
Deep-dive into key metrics, interactive charts, and exploratory analytics. - Experiments:
Analyze all your A/B tests in one place—track performance and discover winners. - Discrepancies:
Find and fix lost traffic. See technical drop-offs and diagnose why paid clicks aren’t converting.
Accessing the Dashboard
- Log in to your Performance Now! account.
- Select the Dashboard tab from the top navigation bar.
- Choose a section from the tab bar to dive into reports, performance, or experiments.
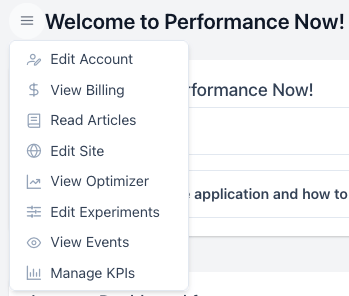
- Use the hamburger menu (three horizontal lines) for quick access to account settings, billing, and support.
How to Navigate
- Use the top (or side) tab bar to switch between sections.
- Each tab loads live, actionable data—no need to refresh.
- Look for export icons, preset menus, and filter controls to customize your view.
New User? Start with Home
Home gives you:
- The Quick Setup section for tracking tags and optimizers.
- Activity snapshot: sessions, users, events, billable activity.
- Access to billing and account management.
- Common questions and support links.
Next Steps
- Explore Reports to answer business questions and save custom views.
- Use Performance for interactive charts and deep analysis.
- Analyze Experiments for A/B test results.
- Troubleshoot with Discrepancies if you notice data loss or technical gaps.
For a detailed walkthrough of each section, select a tab above or jump directly to its guide.