Appearance
Discrepancies Tab
The Discrepancies tab in Performance Now! is your go-to tool for identifying and resolving technical issues that can lead to lost traffic, especially from paid sources. It helps you catch problems that standard analytics might miss, ensuring you maximize the value of every click. 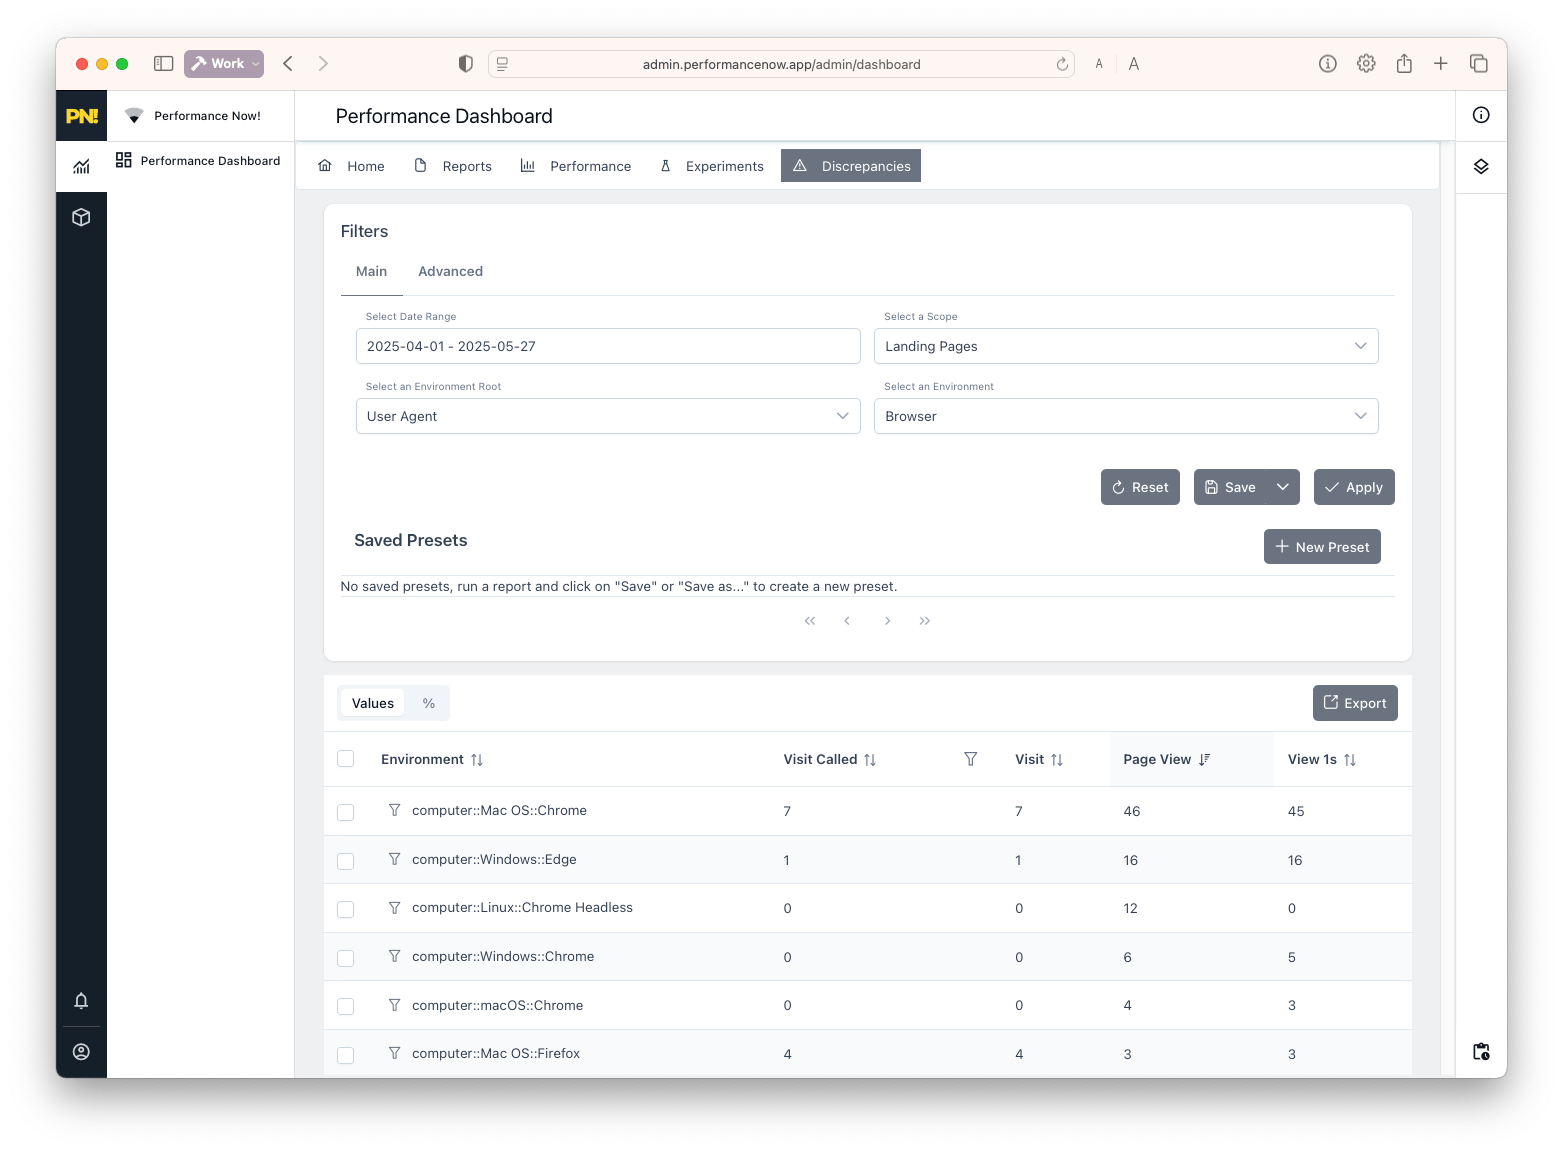
Why Discrepancies Matter
Paid traffic is a significant investment, and any loss due to technical issues can directly impact your ROI. The Discrepancies tab helps you:
- Identify technical errors that cause traffic loss.
- Analyze landing page discrepancies between what ad networks report and what your site receives.
- Detect issues at the network and session level that standard analytics might overlook.
What This Tab Shows
- Technical indicators by pivot (browser, OS, device, etc.):
See which segments of your traffic are being lost due to technical errors or mismatches. - Landing page discrepancies:
If you use the click command, analyze differences between what the ad network/publisher reports and what your site receives. - Unique: Not found in standard analytics—detects issues at the network and session level.
Note to Shopify Users
If using Shopify tags, it’s normal to see twice as many tag calls per page view. This is expected behavior and not a technical issue, and also applies to any tag management system that tracks event and does A/B testing separately.
How to Use
Main Filters
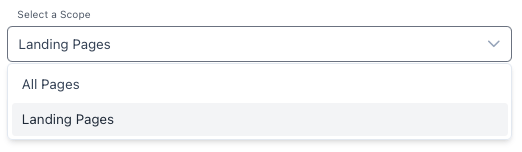 Set the Scope to focus your analysis:
- All Pages:
Identify technical issues on tracked pages—look for pivots (e.g., browsers or devices) with abnormally high loss. - Landing Pages:
See discrepancies between incoming clicks and actual visits, by network, source, or landing page.
Data Table
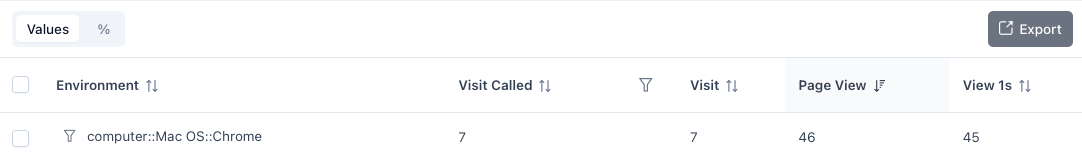
The table shows discrepancies by:
- Value:
The number of times a an event occurred - Percentage:
The percentage of a event compared to the first column
You can select any row to export the data for further analysis by checking the box next to the row and clicking the Export button at the top of the table.
You can filter the report by clicking on the filter icon next to the row and heading, or by using the Advanced panel to set custom filters.
Next Steps: Fix What You Find
Don’t just observe—take these actions:
- Technical Issues (All Pages):
- If a browser, device, or OS shows significant losses, alert your IT or dev team.
Common causes: JavaScript errors, unsupported browsers, blocked tags. - Review your tag installation—incorrect placement or tag blocking is a frequent culprit.
- If a browser, device, or OS shows significant losses, alert your IT or dev team.
- Landing Page Discrepancies:
- Quickly cut or adjust campaigns, traffic sources, or ad networks with high lost click rates.
Experience shows these sources are often low quality, bot-heavy, or irrelevant. - Use this data to negotiate with media partners or exclude bad sources entirely.
- Quickly cut or adjust campaigns, traffic sources, or ad networks with high lost click rates.
- Document issues and follow up:
Use exports to share findings with technical or media teams.
Best Practices
- Routinely check discrepancies to catch issues early.
- Pair with Reports and Performance tabs to correlate technical and business impact.
- When in doubt, contact support for a deep dive into your traffic loss patterns.